Utility interconnection queues now average 53 months nationally. In PJM and CAISO, wait times exceed 58 months. For sponsors underwriting data center deals, every month of delay costs $800,000 to $1 million per megawatt in lost revenue.
The math is brutal. A 100 MW data center sitting idle for 24 months represents $2 billion to $2.4 billion in foregone NOI. Traditional interconnection timelines now destroy project IRRs before the first server goes live.
Sponsors who treat power as a checkbox will lose deals to sponsors who treat power as a strategic lever. This article breaks down the four power alternatives reshaping data center underwriting in 2026.
Key Takeaways
- Interconnection delays average 53 months nationally, with PJM and CAISO exceeding 58 months, up from under 24 months a decade ago.
- Opportunity cost is staggering: $10M–$12M/MW/year in lost revenue × 24 months = $20M–$24M per MW in foregone cash flow.
- Four power pathways offer different speed/cost trade-offs: traditional grid, behind-the-meter natural gas, fuel cells, and co-location with existing generation.
- Speed costs money, but delay costs more: BTM solutions add $1M–$6M/MW in capex but eliminate $20M–$48M/MW in opportunity cost.
- Regional risk varies dramatically: ERCOT offers 36-month timelines with BYOP mandates; PJM requires 58+ months or BTM alternatives.
The Interconnection Bottleneck
Interconnection queues are where data center deals die.
The national average wait time for utility interconnection hit 53 months in 2026. PJM leads the dysfunction at 58 months, followed closely by CAISO at 56 months. FERC Order 2023 reduced speculative projects by over 50%, but it didn’t reduce wait times for projects in the queue. The bottleneck isn’t process, it’s transmission capacity.
Data centers generate $10 million to $12 million per megawatt annually once operational. Every month of interconnection delay costs sponsors $833,000 to $1 million per MW. On a 100 MW facility, a two-year delay erases $2 billion in potential revenue.
Table 2: Opportunity Cost of Interconnection Delay
| Delay (Months) | Revenue/MW/Year ($M) | Lost Revenue/MW ($M) | 100 MW Facility Loss ($M) |
|---|---|---|---|
| 12 | $10–12 | $10–12 | $1,000–1,200 |
| 24 | $10–12 | $20–24 | $2,000–2,400 |
| 36 | $10–12 | $30–36 | $3,000–3,600 |
Source: Revenue assumptions from S&P Global Market Intelligence and industry reports.
Even accounting for 18–24 month construction timelines, interconnection delays push break-even out by four to five years. IRRs that underwrote at 14%–16% collapse to single digits. Equity walks. Lenders reprice or exit.
The question isn’t whether interconnection is slow. It’s whether sponsors can afford to wait.
Four Power Alternatives: A Decision Framework
Sponsors now face a binary choice: wait for the grid, or build around it.
Four distinct power pathways have emerged, each trading upfront cost against speed and certainty.
Table 1: Power Pathway Comparison Matrix
| Pathway | Timeline | Capex per MW | Regulatory Complexity | Best Use Case |
|---|---|---|---|---|
| Grid Interconnection | 40–60 months | $2M–$5M | High (ISO queue, utility approval) | Patient capital, established markets |
| BTM Natural Gas | 12–24 months | $3M–$6M | Medium (air permits, fuel contracts) | Speed-critical, multi-year grid delays |
| Fuel Cell Systems | 2–6 months | $5M–$8M | Low (minimal permitting) | Ultra-fast deployment, bridge to grid |
| Co-Location | 18–36 months | $4M–$7M | Medium (ISO coordination, PPA terms) | Near existing plants, renewable mandates |
Sources: RMI, S&P Global, Brattle Group, Morgan Lewis 2026 reports.
Traditional Grid Interconnection
Still the default, but increasingly risky. Sponsors submit load interconnection requests, wait for studies, and pay for grid upgrades. Timeline: 40–60 months. Capex: $2M–$5M/MW. The advantage is no stranded assets. The disadvantage is unpredictable timelines and ballooning upgrade costs.
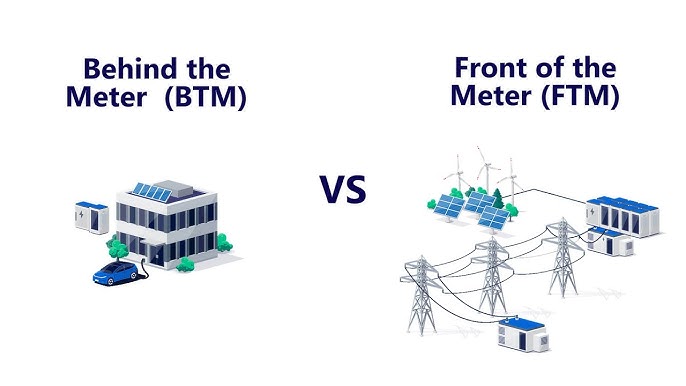
Behind-the-Meter Natural Gas
BTM natural gas generation bypasses the grid entirely. Sponsors install modular turbines or reciprocating engines on-site, operating as a microgrid. Timeline: 12–24 months. Capex: $3M–$6M/MW. Fastest large-scale solution available. VoltaGrid’s 2.3 GW deployment for Oracle’s Project Stargate in Texas is the flagship example. Requires air permits and fuel contracts. Becomes backup power if the grid eventually connects.
Fuel Cell Systems
Fuel cells (particularly Bloom Energy’s SOFC systems) offer the fastest deployment: 50-day delivery, operational in 2–6 months. Capex: $5M–$8M/MW. Higher per-kW cost but modular and ultra-fast. Minimal permitting. Lower emissions than combustion turbines. Best used as bridge power or permanent off-grid solution. Brookfield Asset Management committed $5 billion in 2025 to deploy Bloom fuel cells at AI data centers.
Co-Location with Existing Generation
Co-location pairs data centers with new or existing power plants, leveraging the plant’s grid interconnection. Sponsors partner with renewable developers to build solar/wind adjacent to the facility. Timeline: 18–36 months. Capex: $4M–$7M/MW. Avoids the load queue but limits site selection. Google announced a $20 billion plan in 2025 to co-locate data centers with new renewable projects.
The Economics: Speed vs. Capex
Every power pathway trades upfront cost against speed.
BTM solutions cost $1M–$6M more per MW than traditional interconnection. On a 100 MW facility, that’s $100M–$600M in additional capex.
But if that investment buys 24 months of timeline acceleration, it saves $2 billion to $2.4 billion in lost revenue.
The capex delta is real. But the opportunity cost saved is an order of magnitude larger.
Example: A 100 MW data center in PJM faces a 58-month interconnection timeline. The sponsor chooses BTM natural gas instead, deploying in 18 months. BTM costs $5M/MW vs. $3M/MW for grid interconnection, an incremental $200M.
But BTM accelerates revenue by 40 months (58 – 18 = 40). At $11M/MW/year, that’s $36.7M/MW in revenue pulled forward, or $3.67 billion for the facility.
Net value: $3.47 billion after deducting the $200M incremental capex.
Accelerating power by 24 months typically adds 200–400 basis points to levered project IRR. For institutional investors targeting 14%–16% returns, that’s the difference between a hold and a pass.
Regional Risk: Not All Grids Are Equal
Interconnection timelines vary dramatically by ISO.
PJM (Mid-Atlantic, Midwest): 58 months average. Northern Virginia alone has 10+ GW in the queue. PJM is exploring “flexible interconnection” rules that allow faster connection in exchange for curtailment rights. Dominion Energy has publicly stated it cannot serve new large loads without multi-year transmission buildout.
CAISO (California): 56 months average. Environmental review (CEQA) adds 12–24 months. Local opposition to data centers in drought-prone regions adds further delays.
ERCOT (Texas): 36 months average, fastest in the country. But Texas Senate Bill 6 requires loads over 75 MW to provide demand flexibility or bring their own power. Most hyperscale AI campuses in Texas are choosing BYOP.
NYISO (New York): 52 months average. Urban transmission constraints limit capacity.
Investor takeaway: PJM and CAISO deals require BTM strategies or flexible interconnection commitments. ERCOT offers speed but mandates BYOP. Regional queue risk is now as critical as submarket fundamentals.
Due Diligence Checklist for Investors
Power risk is acquisition risk. Buyers evaluating data center assets must scrutinize power strategy as rigorously as tenant credit.
8 Critical Questions Every Investor Should Ask
Look for queue number, study phase, and utility timeline. Anything beyond 36 months is high-risk.
Study reports reveal hidden costs. $10M+ in unexpected upgrades can sink a deal.
“Conditional” or “subject to upgrades” agreements are not firm. Insist on executed interconnection service agreements.
Firm natural gas transportation contracts vs. interruptible supply makes or breaks reliability.
Major source permits trigger PSD review and can take 18–24 months to modify.
Hybrid offers flexibility but adds complexity.
Does it become backup power? Can it be redeployed? Underwrite residual value at 40%–60% of original capex.
AI training workloads tolerate brief interruptions. Financial services tenants do not. Match power strategy to tenant SLAs.
Conclusion
Power strategy is no longer a back-office function. It’s a front-end underwriting decision that determines whether a data center deal works.
Interconnection delays now exceed four years in the most congested markets. The opportunity cost, measured in billions of dollars, dwarfs the incremental capex of behind-the-meter alternatives.
Sponsors who quantify opportunity cost as rigorously as capex, evaluate regional queue risk, and ask the right due diligence questions will capture outsized returns in a supply-constrained market.
The data center boom isn’t slowing. But the grid isn’t keeping up. Investors who master speed-to-power will win.
Sources
- Morgan Lewis, 2026 US Data Centers and Energy Report (January 2026)
- RMI, Fast, Flexible Solutions for Data Centers (July 2025)
- S&P Global Market Intelligence, Behind-the-Meter Power (October 2025)
- Lawrence Berkeley National Laboratory, Interconnection Queue Data (2025)
- FERC Order 2023 (2024); Texas Senate Bill 6 (2025)
- Bloom Energy, VoltaGrid, GE Vernova press releases (2025–2026)